The honourable Supreme Court of India had ordered the State Bank of India (SBI) to provide all the details of electoral bonds to the Election Commission of India (ECI), who was then required to make it public. After initial hesitation, SBI finally provided all the details and ECI has published those details on their website. Out of curiosity, I downloaded the data and visualized it. This post is just a part of that visualization.
Disclaimer
Before we proceed, following points must be kept in mind while reading.
- The data is downloaded from ECI website. It was in a PDF file and I have used "online PDF to EXCEL" conversion tool provided by Adobe Inc. Though, I have reviewed a few random rows to check the conversion accuracy, it is not guaranteed for the whole data. I make no claim on the correctness of the processed data.
- The visualization is done using Python with the help of common data science related libraries like Pandas, numpy, matplotlib etc.
- The whole exercise is basically a data analysis and visualization focused. Commentary is intentionally brief and avoids interpretation within political domain. By visiting my blog you have already proved that you are wise ;), so read it and have your own interpretations.
Now, let's get started.
Examine the data
Receivers i.e. political parties data
import pandas as pd
import numpy as np
import matplotlib.pyplot as plt
receivers = pd.read_csv("receiver.csv")
donors = pd.read_csv("donor.csv")
receivers.head(3)
Sr No. Date of\nEncashment Name of the Political Party ... Denominations Pay Branch\nCode Pay Teller 0 1 12/Apr/2019 ALL INDIA ANNA DRAVIDA MUNNETRA KAZHAGAM ... 1,00,00,000 00800 2770121 1 2 12/Apr/2019 ALL INDIA ANNA DRAVIDA MUNNETRA KAZHAGAM ... 1,00,00,000 00800 2770121 2 3 12/Apr/2019 ALL INDIA ANNA DRAVIDA MUNNETRA KAZHAGAM ... 1,00,00,000 00800 2770121 [3 rows x 9 columns]
Donors
donors.head(3)Sr No. Reference No (URN) Journal Date Date of\nPurchase Date of Expiry ... Bond\nNumber Denominations Issue Branch Code Issue Teller Status 0 1 00001201904120000001166 12/Apr/2019 12/Apr/2019 26/Apr/2019 ... 11448 10,00,000 00001 5899230 Paid 1 2 00001201904120000001166 12/Apr/2019 12/Apr/2019 26/Apr/2019 ... 11447 10,00,000 00001 5899230 Paid 2 3 00001201904120000001166 12/Apr/2019 12/Apr/2019 26/Apr/2019 ... 11441 10,00,000 00001 5899230 Paid [3 rows x 12 columns]
The receivers dataframe contains the information about the bonds encashed by political parties whereas donors dataframe contains the donors who purchased the electoral bonds. Following cleaning is required on the data
- The column headers need to be changed so as to make it easy to handle in the code.
- There are some columns which are of no interest to us and hence can be deleted.
- Data in columns is not in appropriate format, for ex: "Date of Expiry" is a
stringin the dataframe, but we need it to bedateformatted for using it as a timeseries. - Political party names are written in full. We need to shorten them.
- Merge both dataframes based on bond numbers.
- Some more cleaning of data is also required.
So let's just do all that and see some more details about the data.
receivers.drop(receivers[receivers["Sr No."]=="Sr No."].index, inplace=True)
donors.drop(donors[donors["Sr No."]=="Sr No."].index, inplace=True)
receivers.drop(["Sr No.", "Pay Teller", "Pay Branch\nCode"], axis=1, inplace=True)
donors.drop(["Sr No.", "Issue Branch Code", "Issue Teller", "Reference No  (URN)"], axis=1, inplace=True)

receivers.rename(columns={
    "Date of\nEncashment": "encash_date",
    "Name of the Political Party": "pol_party",
    "Account no. of\nPolitical Party": "party_acc_no",
    "Prefix": "prefix",
    "Bond\nNumber": "bond_num",
    "Denominations": "denominations",
    "Pay Branch\nCode": "branch_code",
    "Pay Teller": "pay_teller"
}, inplace=True)
donors.rename(columns={
    "Reference No  (URN)": "urn",
    "Journal Date": "journal_date",
    "Date of\nPurchase": "purchase_date",
    "Date of Expiry": "expiry_date",
    "Name of the Purchaser": "purchaser",
    "Prefix": "prefix",
    "Bond\nNumber": "bond_num",
    "Denominations": "denominations",
    "Issue Branch Code": "issue_branch",
    "Issue Teller": "issue_teller",
    "Status": "status"
}, inplace=True)
Now, let's look at the status of all bonds.
There are total 18871 bonds in the donors dataframe, of which 18741 bonds were paid while 130 expired.
donors["status"].value_counts()status Paid 18741 Expired 130 Name: count, dtype: int64
Let' replace the party names with their short names.
parties = {
    "ALL INDIA ANNA DRAVIDA MUNNETRA KAZHAGAM" : "AIADMK",
    "AAM AADMI PARTY": "AAP",
    "ADYAKSHA SAMAJVADI PARTY": "ASP",
    "ALL INDIA TRINAMOOL CONGRESS": "TMC",
    "BHARAT RASHTRA SAMITHI": "BRS",
    "BHARATIYA JANATA PARTY": "BJP",
    "BIHAR PRADESH JANTA DAL(UNITED)": "JD(U)",
    "BIJU JANATA DAL": "BIJU JD",
    "DRAVIDA MUNNETRA KAZHAGAM (DMK)": "DMK",
    "GOA FORWARD PARTY": "GFP",
    "JAMMU AND KASHMIR NATIONAL CONFERENCE": "NC",
    "JANASENA PARTY": "JANASENA",
    "JANATA DAL ( SECULAR )": "JDS",
    "JHARKHAND MUKTI MORCHA": "JMM",
    "MAHARASHTRAWADI GOMNTAK PARTY": "GOMANTAK",
    "NATIONALIST CONGRESS PARTY MAHARASHTRA PRADESH": "NCC",
    "PRESIDENT, ALL INDIA CONGRESS COMMITTEE": "INC",
    "RASHTRIYA JANTA DAL": "RJD",
    "SHIROMANI AKALI DAL": "SAD",
    "SHIVSENA": "SHIVSENA",
    "SIKKIM DEMOCRATIC FRONT": "SDF",
    "SIKKIM KRANTIKARI MORCHA": "SKM",
    "TELUGU DESAM PARTY": "TDP",
    "YSR  CONGRESS PARTY  (YUVAJANA SRAMIKA RYTHU CONGRESS PARTY)": "YSRCONG",
}

receivers = receivers.replace({
    "pol_party": parties,
})
Also, let's replace some company names to their short names. Moreover, many company names had minor spelling mistakes in different records. So, there is a need to correct them. Some company names are replaced with their group, for ex multiple Bajaj companies are clubbed together in "BAJAJ COMPANIES". I may not have done the clubbing exercise with utmost precision. However, that is unlikely to cause any significant issue with the oerall analysis.
companies = {
    r"^AASHMAN": "AASHMAN ENERGY",
    r"^ACHINTYA": "ACHINTYA SOLAR",
    r"^APCO": "APCO INFRA",
    r"^ARVIND\b": "ARVIND LTD",
    r"^ASKUS": "ASKUS LOGISTICS",
    r"^AUROBINDO": "AURO PHARMA",
    r"^AVEES": "AVEES TRADING",
    r"^BAJAJ": "BAJAJ COMPANIES",
    r"^BALU IRON": "BALU IRON",
    r"^BANSAL": "BANSAL",
    r"^BESSEGGEN": "BESSEGGEN INFOTECH",
    r"^BHARTI": "BHARTI AIRTEL",
    r"^BIRLA": "BIRLA COMPANIES",
    r"^CIPLA": "CIPLA LTD",
    r"^COMFORT": "COMFORT TRIMS",
    r"^CROCHET": "CROCHET TRADE",
    r"^D S ENGINEERING": "D S ENGG",
    r"^DASAMI": "DASAMI LAB",
    r"^DCM": "DCM SHRIRAM LTD",
    r"^DERIVE": "DERIVE TRADING",
    r"^DIVYASREE": "DIVYASREE",
    r"^DIVYESH": "DIVYESH POWER",
    r"^DLF": "DLF",
    r"^DR": "DR REDDY LAB",
    r"^ELENA": "ELENA RENEWABLE",
    r"^FUTURE": "FUTURE GAMING",
    r"^GENUS": "GENUS POWER",
    r"^GOODLUCK": "GOODLUCK INDIA",
    r"^GREENKO": "GREENKO COMPANIES",
    r"^HETERO": "HETERO BIO COMPANIES",
    r"^HINDYS": "HINDYS LAB",
    r"^HONOUR": "HONOUR LAB",
    r"^IDEAL": "IDEAL REAL ESTATE",
    r"^INFOTEL": "INFOTEL TECHNOLOGIES",
    r"^INORBIT": "INORBIT MALLS",
    r"^INOX": "INOX",
    r"^INTERGLOBE": "INDIGO",
    r"^J K CEMENT": "J K CEMENT",
    r"^JINDAL": "JINDAL COMPANIES",
    r"^KITEX": "KITEX GARMENTS",
    r"^LAXMI INDUSTRIAL": "LAXMI BOTTLING",
    r"^MEGHA": "MEGHA ENGG",
    r"^MICRO": "MICRO LABS",
    r"^MKJ": "MKJ ENTERPRISES",
    r"^MKK": "MKK METAL",
    r"^MODERN": "MODERN ROAD MAKERS",
    r"^MOHIT": "MOHIT MINERALS",
    r"^MSN": "MSN COMPANIES",
    r"^MY HOME": "MY HOME INFRA",
    r"^MYTRAH": "MYTRAH ENERGY",
    r"^NATCO": "NATCO PHARMA",
    r"^NAVAYUGA": "NAVAYUGA ENGG",
    r"^NSL": "NSL COMPANIES",
    r"^NUVOCO": "NUVOCO",
    r"^ORISSA": "ORISSA METALIKS",
    r"^PALM": "PALM ESTATE",
    r"^PENGUIN": "PENGUIN TRADING",
    r"^PHIL": "PHILIPS",
    r"^PIRAMAL": "PIRAMAL COMPANIES",
    r"^PRESTIGE": "PRESTIGE COMPANIES",
    r"^PROCURE": "PROCURE ADVISORY",
    r"^QWIK": "QWIK SUPPLY",
    r"^R.S.": "R.S.BROTHERS RETAIL",
    r"^RIPLEY": "RIPLEY",
    r"^ROSHNI": "ROSHNI",
    r"^SEI": "SEI COMPANIES",
    r"^SELMAR": "SELMAR LAB",
    r"^SENGUPTA": "SENGUPTA PVT LTD",
    r"^SHREE CEMENT": "SHREE CEMENT",
    r"^SHREYAS": "SHREYAS RENEWABLE",
    r"^SILVERTONE": "SILVERTONE SECURITIES",
    r"^SKEIRON": "SKEIRON RENEWABLE",
    r"^SOM DIST": "SOM DISTILLERIES",
    r"^SPECO": "SPECO INFRA",
    r"^SUN PHARMA": "SUN PHARMA",
    r"^THRIVENI": "THRIVENI COMPANIES",
    r"^TORRENT\s*POWER": "TORRENT POWER",
    r"^TORRENT\s*PHARMA": "TORRENT PHARMA",
    r"^TRANSWAYS": "TRANSWAYS EXIM",
    r"^TRIDENT\b": "TRIDENT LTD",
    r"^TVS": "TVS COMPANIES",
    r"^ULTRA": "ULTRATECH CEMENTS",
    r"^UTKAL": "UTKAL ALUMINA",
    r"^V M SALGAOCAR": "V M SALGAOCAR COMPANIES",
    r"^VAMSIRAM\b": "VAMSIRAM BUILDERs COMPANIES",
    r"^VARDHMAN": "VARDHMAN TEXTILES",
    r"^VEDANTA": "VEDANTA",
    r"^WELSPUN": "WELSPUN COMPANIES",
    r"^ZUVAN": "ZUVAN ENERGY",
}

for k, v in companies.items():
    donors.loc[donors["purchaser"].str.contains(k), "purchaser"] = v
Let's merge the donors and receivers dataframes into one single dataframe based on unique alphanumeric bond numbers.
In the datasets, the bond number is split into two parts, prefix and bond_num.
As both the dataframes contain column named denominations, the merged dataset will have two columns named denominations_x and denominations_y.
The denominations_x/y columns are having amount donated but in string format.
We need to change them to numbers.
And some other columns to datetime format.
donors = donors.astype({"bond_num": "int32"})
receivers = receivers.astype({"bond_num": "int32"})
df = pd.merge(donors, receivers, on=["bond_num", "prefix"], how="outer")
for col in df:
    if "date" in col:
        df[col] = pd.to_datetime(df[col], errors="coerce")

def str2num(x):
    try:
        v = int(x.replace(",", ""))
    except:
        v = np.nan
    return v
df["denominations"] = df["denominations_y"].apply(str2num)
Now we have clean merged data ready to analyze.
Clean merged data
Let's have a look at the data.
df.head(3)journal_date purchase_date expiry_date purchaser prefix bond_num ... status encash_date pol_party party_acc_no denominations_y denominations 0 2021-04-07 2021-04-07 2021-04-21 N RAMAMOORTHY OT 8 ... Expired NaT NaN NaN NaN NaN 1 2023-07-10 2023-07-10 2023-07-24 ARAVIND S OT 10 ... Paid 2023-07-24 BJP *******8244 1,000 1000.0 2 NaT NaT NaT NaN TL 75 ... NaN 2019-04-16 BJP *******8244 10,00,000 1000000.0 [3 rows x 13 columns]
There are still many company names which are too long and will affect out plot styling. So let's shorten some important company names.
shortnames = {
    r"^HALDIA": "HALDIA ENERGY",
    r"^ESSEL MINING": "ESSEL MINING",
    r"^WESTERN UP": "WESTERN UP POWER",
    r"^KEVENTER": "KEVENTER FOODPARK",
    r"^QWIK": "QWIK SUPPLY",
    r"^DHARIWAL": "DHARIWAL INFRA",
    r"^IFB": "IFB",
    r"^CHENNAI GREEN": "CHENNAI GREEN",
    r"^PRARAMBH SEC": "PRARAMBH SECURITIES",
    r"^YASHODA ": "YASHODA HOSPITAL",
    r"^SASMAL": "SASMAL INFRA",
    r"^SEPC POWER": "SEPC POWER",
    r"^RITHWIK": "RITHWIK PROJECTS",
    r"^INFINA FINANCE": "INFINA FINANCE",
    r"^UNITED PHOS": "UNITED PHOS",
    r"^SRI SIDDHARTH": "SIDDHARTH INFRATECH",
    r"^WESTWELL GASES": "WESTWELL GASES",
    r"^HIMALAYAN ENDEA": "HIMALAYAN ENDEAVOUR",
    r"^IRB MP": "IRB MP EXPRESSWAY",
    r"^B G SHIRKE": "B G SHIRKE",
}

for k, v in shortnames.items():
    df.loc[df["purchaser"].str.contains(k, na=False), "purchaser"] = v
Now we have the necessary cleaned data in our dataframe df. Let's use describe() method on a few useful columns.
df[["purchase_date","purchaser","pol_party","denominations"]].astype("object").describe()
              purchase_date      purchaser pol_party  denominations
count                 18871          18871     20421        20421.0
unique                  146           1173        24            5.0
top     2022-01-05 00:00:00  FUTURE GAMING       BJP     10000000.0
freq                    570           1368      8633        12207.0
This part shows that there are total 18871 bond numbers in "donor" dataframe but 20421 in "receiver" dataframe. I am not sure for the reason for this. The difference of number of bonds is 1550. Let's examine which are these missing bond numbers, their total value and who encashed them.
receivers["ubn"] = receivers[["prefix", "bond_num"]].apply(lambda x: "".join(x.values.astype("str")), axis=1)
donors["ubn"] = donors[["prefix", "bond_num"]].apply(lambda x: "".join(x.values.astype("str")), axis=1)
mismatch = receivers[~receivers["ubn"].isin(donors["ubn"])]
mismatch["denominations"] = mismatch["denominations"].apply(str2num)
mismatch_data = mismatch.groupby(["pol_party"])["denominations"].sum().div(10_000_000)
fig, ax = plt.subplots(constrained_layout=True)
mismatch_data.plot(kind="bar", ax=ax)
ax.set_ylabel("Missing bond amount in Cr (INR)")
plt.savefig("../../static/images/electoral-bonds/mismatch_data.png")
"/images/electoral-bonds/mismatch_data.png"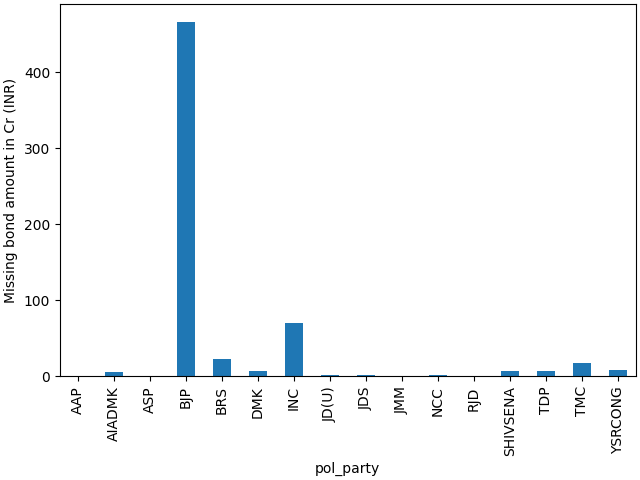
There are total 18741 records of bond purchases since its inception. The bonds were purchased on 146 days in the last 5 years. There are total 1173 companies and individuals who purchased the bonds. This number is not exact because same company may have slightly different spelling in different rows. Though I have tried to account for that by changing such records, there is high probability of me missing a few records. "Future Gaming" is the top purchaser based on "number of bonds" and it has purchased 1368 bonds. Based on number of bonds, the BJP has received maximum number of bonds among the 24 political parties, i.e. 8633. There are 5 denominations of these bonds, Rs. One Thousand, Ten Thousand, One Lakh, Ten Lakh and One Crore and Rs. One Crore, were purchased for 12207 times. This makes the total donations at least Rs. 12207 Crore. Let's have a look at distribution of number of bonds across political parties.
Number analysis
Here, we will see only the number of bonds and their distribution (disregarding the value of each bond).
tdf = df["pol_party"].value_counts(normalize=True).mul(100).round(1).to_frame()[:23]
tdf.transpose()
pol_party BJP TMC INC BRS BIJU JD DMK YSRCONG SHIVSENA TDP AAP RJD NCC JDS SKM ASP JMM JANASENA AIADMK SAD GOMANTAK GFP JD(U) SDF proportion 42.3 16.2 15.4 8.8 4.2 3.2 2.3 1.7 1.4 1.2 0.7 0.6 0.4 0.2 0.2 0.2 0.2 0.2 0.2 0.1 0.1 0.1 0.0
Clearly, BJP received about 42 % of the total number of bonds (not necessarily amount, which we will see soon). Surprisingly, TMC stands second, ahead of INC at least in terms of number of bonds received. You may have noticed that CPI(M) doesn't feature in the list. It was CPI(M) who petitioned the SC against electoral bonds and took a principled stand to not accept any electoral bond.
Top donors
purchaser_wise = df.groupby(["purchaser"])["denominations"].apply(np.sum)/10_000_000
data = purchaser_wise.sort_values(ascending=False)
per_data = data / np.sum(data) * 100
fig, ax = plt.subplots(nrows=1, ncols=2, figsize=(9, 5))
data[0:20].plot(ax=ax[0], kind="bar")
per_data[0:20].plot(ax=ax[1], kind="bar")
ax[0].set_ylabel("Amount in Cr (INR)")
ax[1].set_ylabel("Amount in %")
fig.tight_layout()
plt.savefig("../../static/images/electoral-bonds/top_donors.png")
"/images/electoral-bonds/top_donors.png"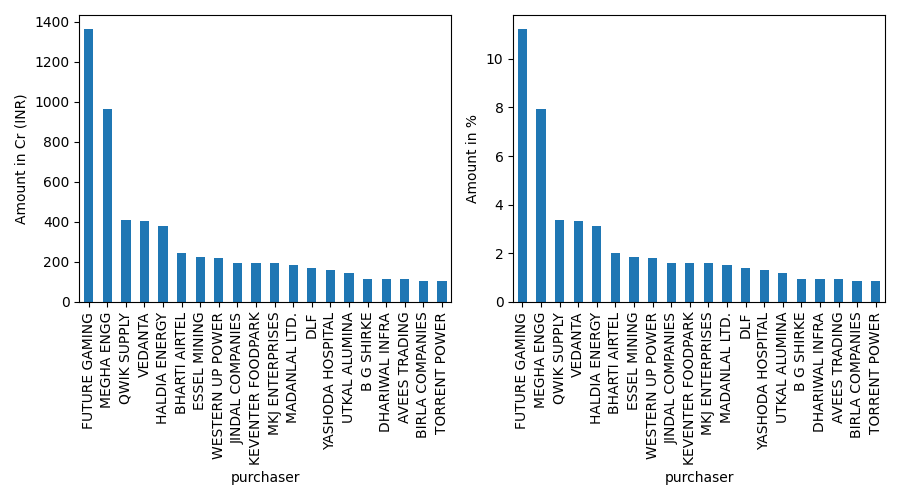
A little over ${1/4}^{th}$ amount is donated by top 4 donors. I would have liked to find out the donations across the sectors such as automobile, infra etc., but only company names are available and their sectors need to be tagged manually. Although, tagging companies for sectors can be partially automated, currently I am not motivated enough to do so.
Donation pattern over time
from matplotlib.gridspec import GridSpec
tsM = df.groupby(df["purchase_date"].dt.to_period("M"))["denominations"].apply(np.sum).mul(1/10_000_000).round(1)
tsQ = df.groupby(df["purchase_date"].dt.to_period("Q-MAR"))["denominations"].apply(np.sum).mul(1/10_000_000).round(1)
tsY = df.groupby(df["purchase_date"].dt.to_period("Y-MAR"))["denominations"].apply(np.sum).mul(1/10_000_000).round(1)
tdf = df.resample("M", on="purchase_date")["denominations"].sum().mul(1/10_000_000).to_frame().reset_index()
tsm = tdf.groupby(tdf["purchase_date"].dt.month)["denominations"].apply(np.sum)
fig = plt.figure(figsize=(16, 10), constrained_layout=True)
gs = GridSpec(2, 2, figure=fig)
ax1 = fig.add_subplot(gs[0, 0])
ax2 = fig.add_subplot(gs[0, 1])
ax3 = fig.add_subplot(gs[1, 0])
ax4 = fig.add_subplot(gs[1, 1])
ax4.vlines([2.5, 5.5, 8.5], 0, 3100, color="r")
ax4.annotate("Q4", (1, 2500), fontsize=20)
ax4.annotate("Q1", (4, 2500), fontsize=20)
ax4.annotate("Q2", (7, 2500), fontsize=20)
ax4.annotate("Q3", (10, 2500), fontsize=20)
tsY.plot(ax=ax1, kind="bar")
tsQ.plot(ax=ax2, kind="bar")
tsM.plot(ax=ax3, kind="bar")
tsm.plot(ax=ax4, kind="bar")
ax1.set_xlabel("Year", fontsize=16)
ax2.set_xlabel("Year-Quarter", fontsize=16)
ax3.set_xlabel("Year-Month", fontsize=16)
ax4.set_xlabel("Month", fontsize=16)
ax1.set_ylabel("Amount in Cr (INR)", fontsize=16)
ax3.set_ylabel("Amount in Cr (INR)", fontsize=16)
plt.savefig("../../static/images/electoral-bonds/ts.png")
"/images/electoral-bonds/ts.png"
The donation pattern over months and financial quarters and financial years is shown in the above figure. Note that the quarters are financial quarters where first quarter of a financial year starts on the $1^{st}$ day of April month of the previous calendar year, i.e. first quarter of the financial year 2021 starts from April 01, 2020. In the financial year 2021, there was very little donation to political parties. This can be attributed to the Covid pandemic. However, political parties have more than made up for their losses during this period by securing significantly higher donations in 2024. The last plot in the above figure shows a very interesting pattern. The donors prefer to donate at the beginning of each quarter and avoid donating at the end of each quarter. Highest total donations are in Q3 followed by Q1.
Top receivers
receiver_wise = df.groupby(["pol_party"])["denominations"].apply(np.sum)/10_000_000
data = receiver_wise.sort_values(ascending=False)
per_data = data / np.sum(data) * 100
fig, ax = plt.subplots(nrows=1, ncols=2, figsize=(9, 5))
data[0:20].plot(ax=ax[0], kind="bar")
per_data[0:20].plot(ax=ax[1], kind="bar")
ax[0].set_ylabel("Amount in Cr (INR)")
ax[1].set_ylabel("Amount in %")
ax[1].set_ylim([0, 50])
fig.tight_layout()
plt.savefig("../../static/images/electoral-bonds/top_receivers.png")
"/images/electoral-bonds/top_receivers.png"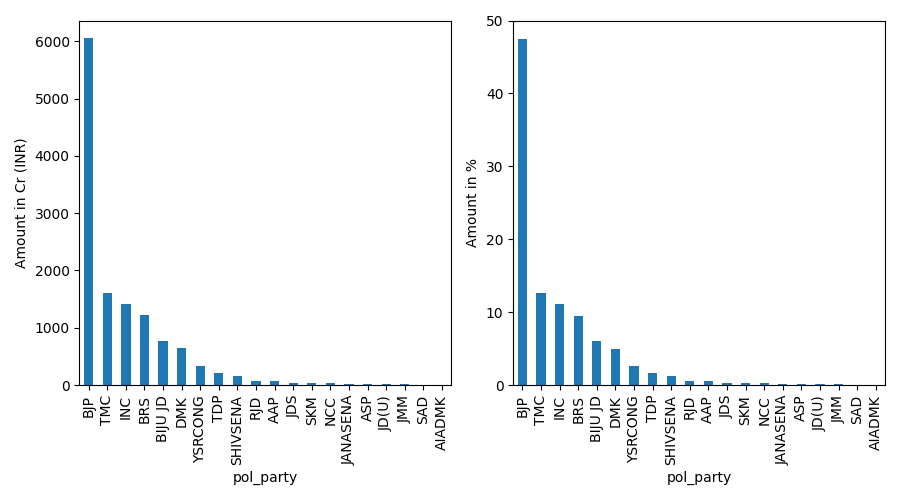
The total donations received are INR 12769 Crores. BJP secured about INR 6060 Crores, which is about 47 % of the total donations. The top 6 parties have received more than 90 % of the donations. Which also means that, from the top 6 parties, BJP managed to secure more amount of donations compared to remaining 5 parties.
Range of donations for each party
import seaborn as sns
party_500cr = data[data > 500].index
party_range = df[df["pol_party"].isin(party_500cr)].groupby(["pol_party", "purchaser"])["denominations"].apply(np.sum)/10_000_000
vdf = party_range.to_frame().reset_index()
fig, ax = plt.subplots()
sns.violinplot(data=vdf, y="pol_party", x="denominations", ax=ax, density_norm="count", split=True, inner="stick", orient="h")
ax.set_xlim([0, 50])
ax.set_xlabel("Denomination (in Cr)")
fig.tight_layout()
plt.savefig("../../static/images/electoral-bonds/party_range.png")
"/images/electoral-bonds/party_range.png"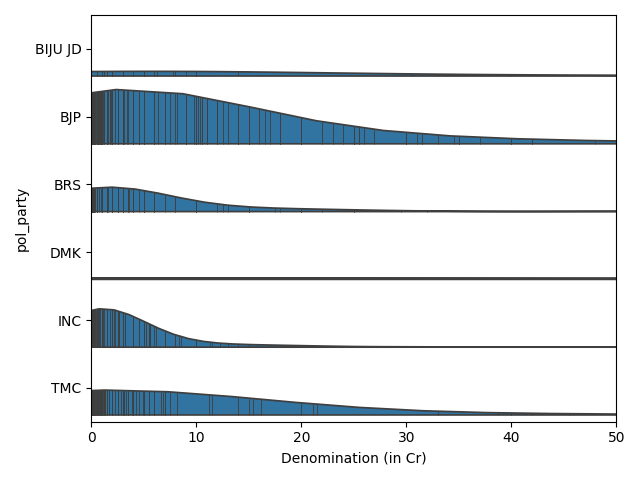
The plot above contains the distribution of donation amount to top 6 political parties. The maximum height of each distribution is proportional to the number of donations received and hence their sizes and shapes are directly comparable. Each vertical line inside the distribution is an observation. BJP has managed to secure donations in low as well as high denominations. When it comes to low value donations, INC is just behind BJP but INC has not many high value denominations. TMC has managed to get significant number of high value denominations compared to INC and BRS. Heights for BIJU JD and DMK are so small at this scale that no remark can be made about them.
Top donors per party
tdf = df[df["pol_party"].isin(party_500cr)].groupby(["pol_party", "purchaser"])["denominations"].sum().div(10_000_000)
sdf = tdf.to_frame().reset_index().sort_values(by=["pol_party", "denominations"], ascending=[True, False]).groupby(["pol_party"]).nth[:2]
sdf = sdf.pivot_table(index="pol_party", columns="purchaser", values="denominations")
fig, ax = plt.subplots(figsize=(9, 6), constrained_layout=True)
sdf.plot(kind="bar", stacked=True, ax=ax, cmap="tab10")
ax.set_ylabel("Amount in Cr (INR)", fontsize=14)
plt.legend(loc="lower left", bbox_to_anchor=(0.0, 1.01), ncols=4, fontsize=9)
plt.savefig("../../static/images/electoral-bonds/top2_per_party.png")
"/images/electoral-bonds/top2_per_party.png"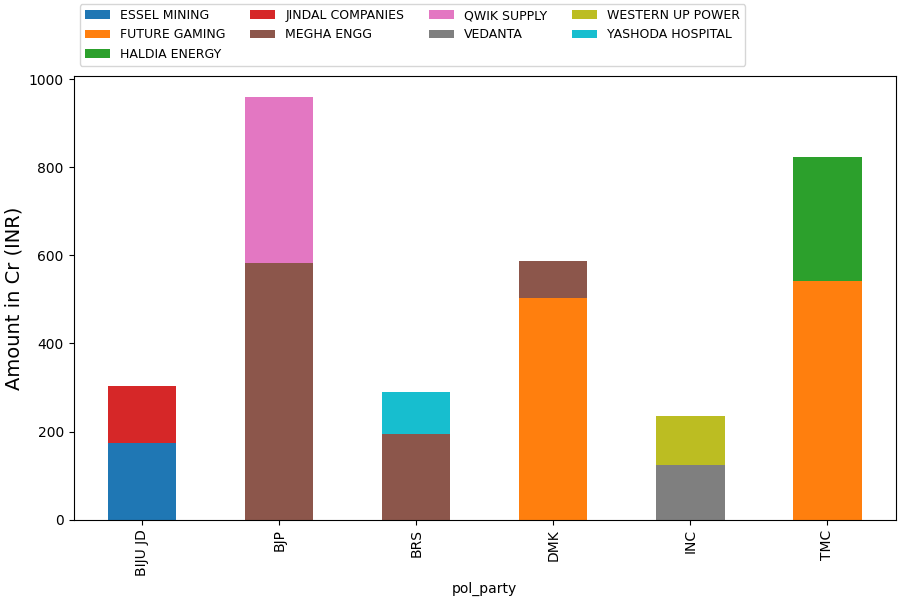
Pattern of top 20 donors
The above plot gives only the top 2 donors for each party and hence does not reflect complete picture of their donation pattern. The following table does the job. It provides donation pattern of top 20 donors across political parties. BJP has received donations from all top 20 parties which is followed by INC, TMC and BIJU JD receiving donations from 15, 7 and 6 donors, respectively.
top20_donors = purchaser_wise.sort_values(ascending=False)[:20]
topd = df.groupby(["purchaser", "pol_party"])["denominations"].sum().div(10_000_000).to_frame().reset_index()
topd = topd[topd["purchaser"].isin(top20_donors.index)]
topd.pivot_table(index="purchaser", columns="pol_party", values="denominations").round(1).fillna("-")
pol_party AAP ASP BIJU JD BJP BRS DMK INC JANASENA JD(U) JDS JMM NC NCC RJD SAD SDF SHIVSENA SKM TDP TMC YSRCONG purchaser AVEES TRADING 10.0 - 3.0 1.0 - - 53.0 - - - - - - - - - - - - 45.5 - B G SHIRKE - - - 30.0 - - 2.0 - - - - - - - - - 85.0 - - - - BHARTI AIRTEL - - - 236.4 - - 8.0 - 1.0 - - 0.5 - 0.1 1.0 - - - - - - BIRLA COMPANIES - - - 105.0 - - - - - - - - - - - - 2.0 - - - - DHARIWAL INFRA - - - 25.0 - - - - - - - - - - - - - - - 90.0 - DLF - - - 170.0 - - - - - - - - - - - - - - - - - ESSEL MINING - - 174.5 50.0 - - - - - - - - - - - - - - - - - FUTURE GAMING - - - 100.0 - 503.0 50.0 - - - - - - - - 5.0 - 11.0 - 542.0 154.0 HALDIA ENERGY - - - 81.0 - - 15.0 - - - - - - - - - - - - 281.0 - JINDAL COMPANIES - - 130.0 42.0 - - 23.0 - - - - - - - - - 0.5 - - - - KEVENTER FOODPARK - 10.0 - 144.5 - - 20.0 - - - - - - - 0.5 - - - - 20.0 - MADANLAL LTD. - - - 175.5 - - 10.0 - - - - - - - - - - - - - - MEGHA ENGG - - - 584.0 195.0 85.0 18.0 4.0 10.0 5.0 - - - - - - - - 28.0 - 37.0 MKJ ENTERPRISES 7.0 - 10.0 26.9 10.0 - 91.6 - - - 1.0 - - - - - - - - 45.9 - QWIK SUPPLY - - - 375.0 - - - - - - - - 10.0 - - - 25.0 - - - - TORRENT POWER 7.0 - - 76.0 - - 17.0 - - - - - 3.5 - - - 3.0 - - - - UTKAL ALUMINA - - 70.0 75.0 - - 0.1 - - - - - - - - - - - - - - VEDANTA - - 40.0 230.2 - - 125.0 - - - 5.0 - - - - - - - - 0.2 1.8 WESTERN UP POWER - - - 80.0 - - 110.0 10.0 - - - - - - - - - - 20.0 - - YASHODA HOSPITAL 1.0 - - 2.0 94.0 - 64.0 - - - - - - - - - - - - - 1.0
Epilogue
Thats all I could do with available data and time. A more rigorous analysis should be done on this data considering its importance. However, that needs a lot more time and other resources. Do let me know what you think about the analysis. Did I miss any obvious metric that should be part of this analysis? Are there any issues with my code (and I agree that the code is ugly right now)?
